AI Project Performance Dashboard Agent
Automating Executive Project Performance Dashboards with AI
Unified Data Integration Across Construction Systems
The agent connects directly to your ERP, project management, scheduling, and safety systems—consolidating job cost, WIP, change orders, and field data into a single governed analytics layer without manual rekeying or spreadsheet tie-outs.
Automated KPI Calculation and Anomaly Alerts
AI automation continuously monitors margin fade, underbilling thresholds, CPI/SPI variances, and AR aging—surfacing exceptions the moment they breach your defined tolerances and routing alerts to the right stakeholders.
Executive-Ready Reporting with Drill-Through Context
The system generates portfolio-level dashboards with filters by company, region, PM, and project type, enabling executives to move from high-level KPIs to job-level detail in seconds rather than waiting for monthly static reports.
How Cassidy automates using AI
Step 1: Trigger on data refresh or scheduled cadence
The Workflow activates on your defined schedule—daily for near real-time WIP updates, weekly for labor productivity reviews, or monthly aligned with accounting close—or triggers immediately when new data lands from your ERP or PM platform.
Step 2: Ingest and harmonize multi-system data
Cassidy pulls job cost, commitments, AR/AP, change orders, labor hours, RFIs, submittals, and safety data from connected systems like Viewpoint, Procore, Sage, or Primavera P6, conforming cost codes and normalizing vendor and project master data into a unified model.
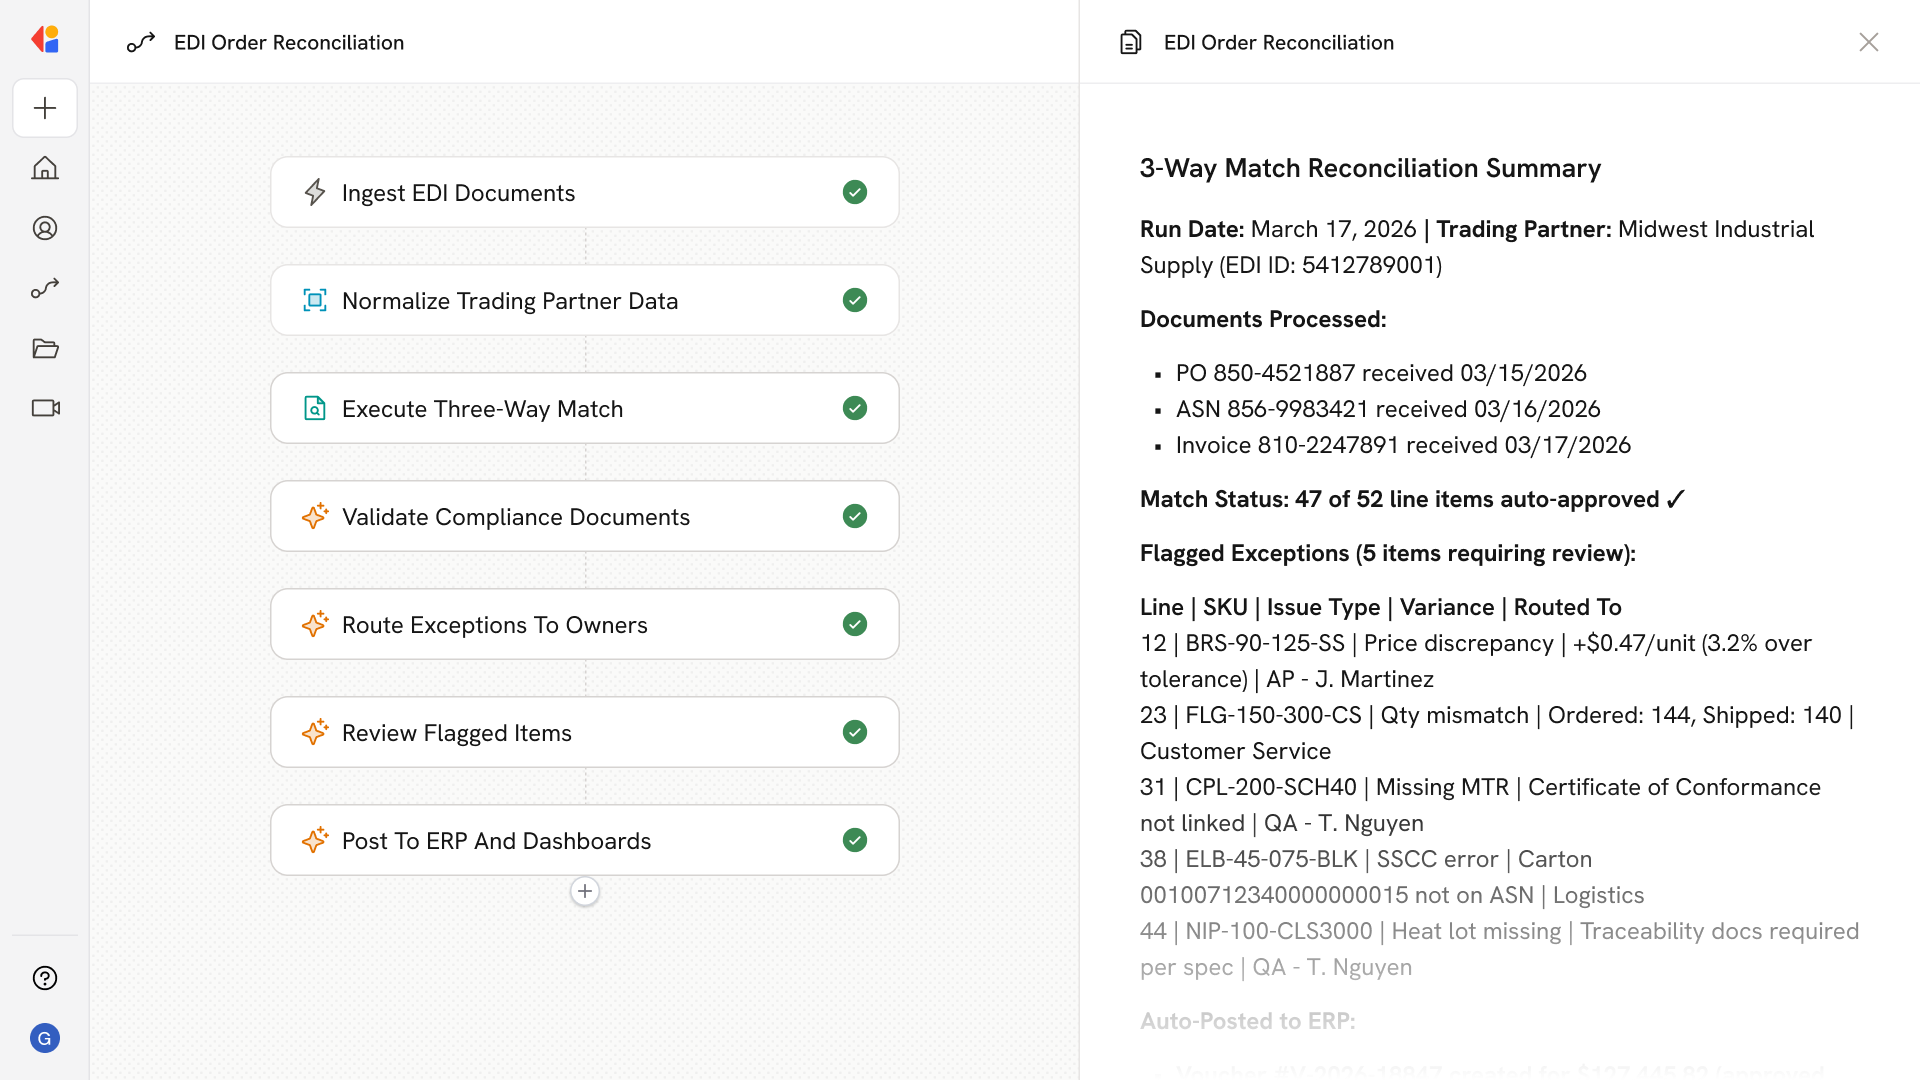
Step 3: Calculate KPIs and run anomaly detection
The Workflow applies your standardized KPI logic—earned revenue, margin fade, over/under billing, CPI/SPI, CO exposure, DSO—and runs rule-based and statistical anomaly detection against your configured thresholds.
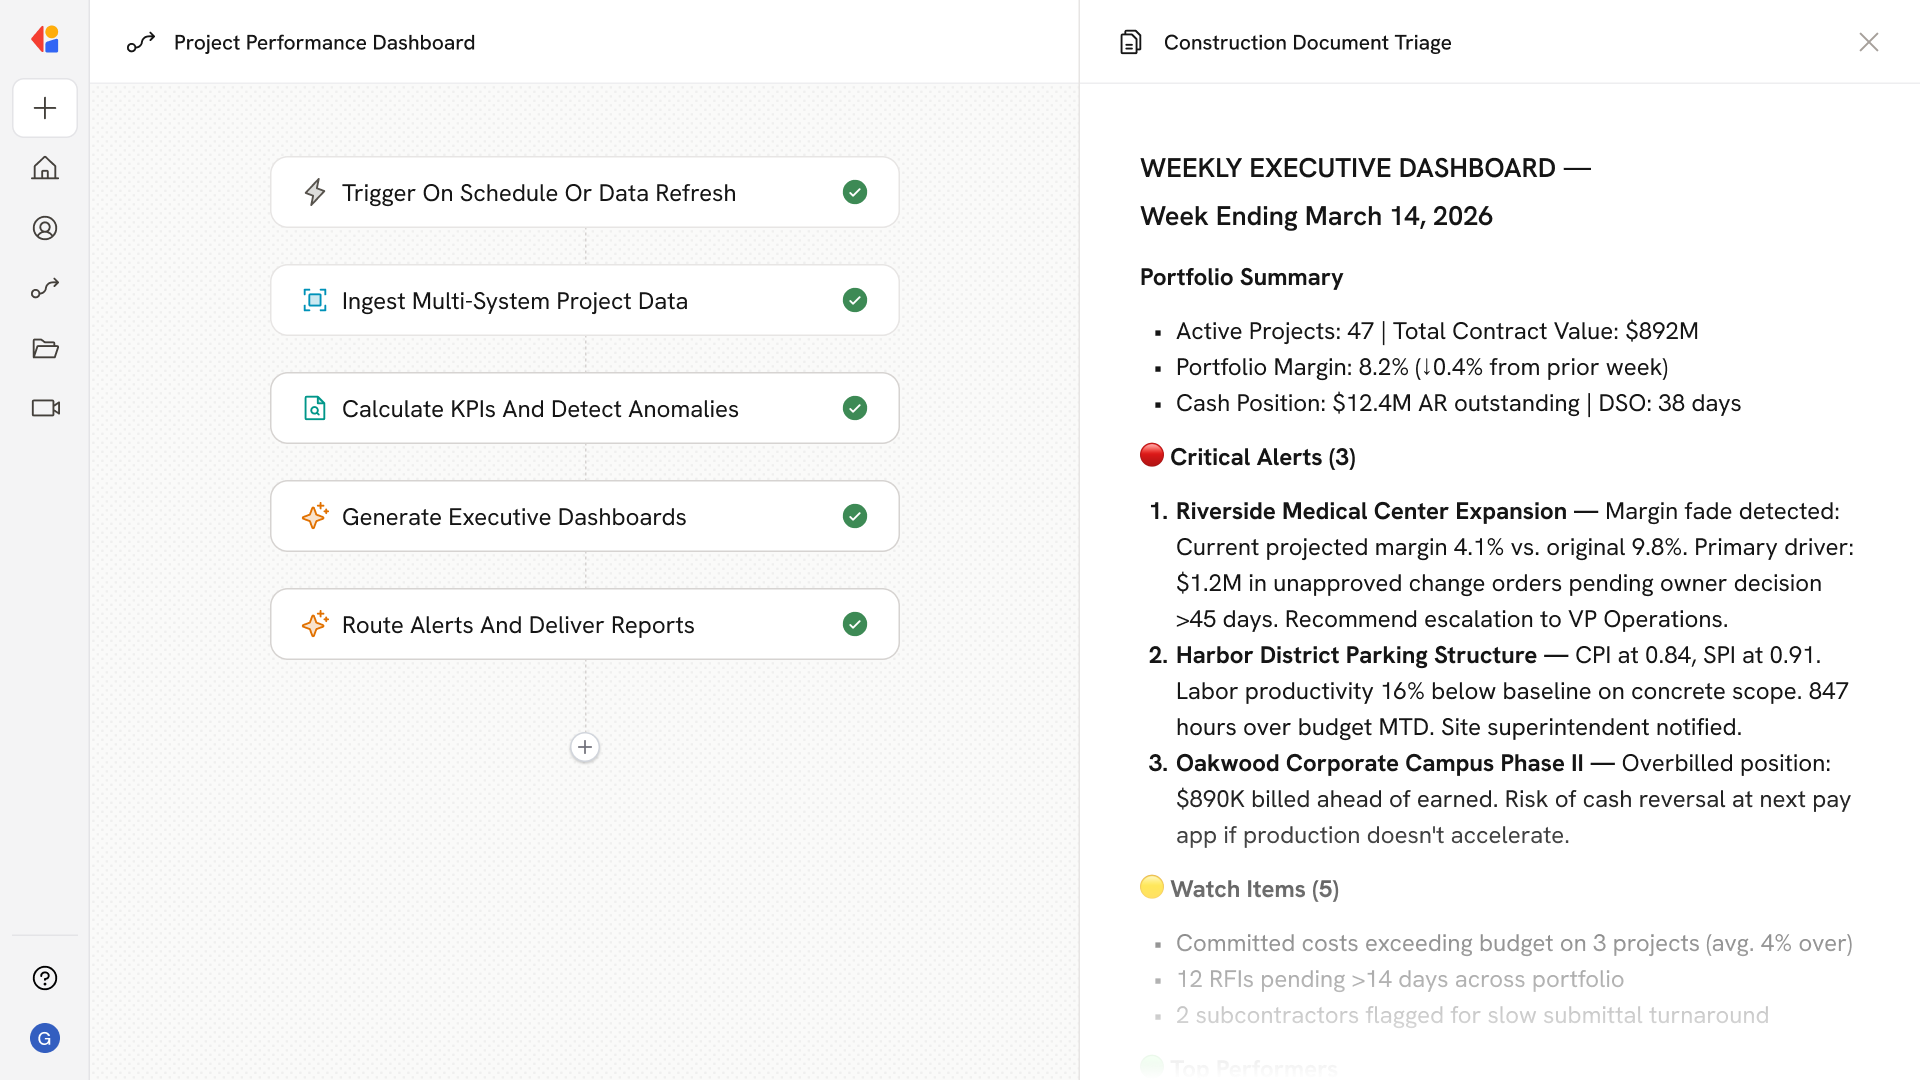
Step 4: Generate executive dashboards and drill-through views
Cassidy assembles portfolio-level dashboards with trend lines, variance waterfalls, and traffic-light status indicators, enabling drill-through from company and region views down to individual job and cost code detail.
Step 5: Route alerts and deliver reports
When anomalies breach thresholds, Cassidy sends contextual alerts via email, Teams, or Slack with direct links to the affected job. Scheduled executive summaries and ROI reports are delivered to stakeholders on your defined cadence.
Implement it inside your company
- Hands-on onboarding and support
- Self-paced training for your team
- Dedicated implementation experts
- Ongoing use case discovery
- ROI tracking & analytics dashboards
- Proven playbooks to get started fast