AI Loss Run Parsing Agent
Automating Loss Run Parsing with AI
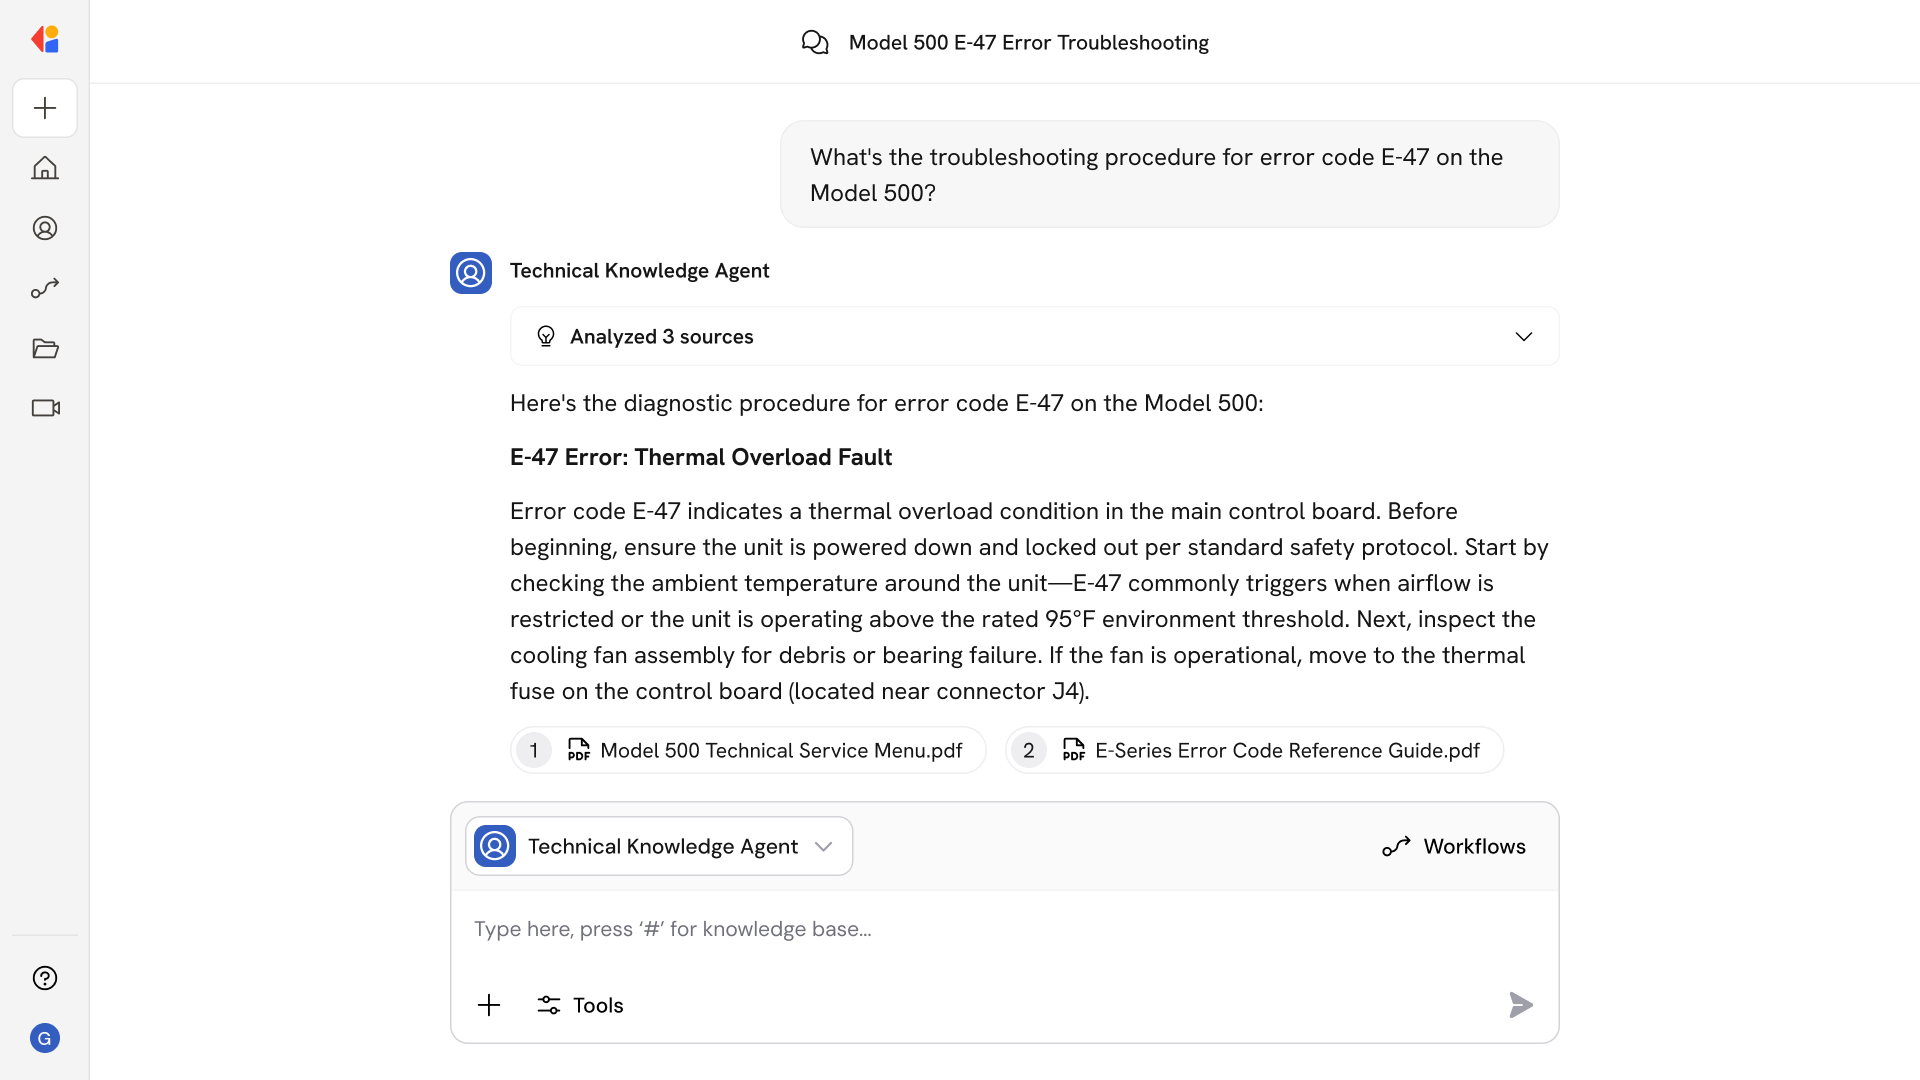
Handle any format, from any carrier
The agent processes native PDFs, scanned documents, Excel files, and merged multi-carrier reports—extracting claim tables, nested data, and multi-page continuity regardless of layout variability.
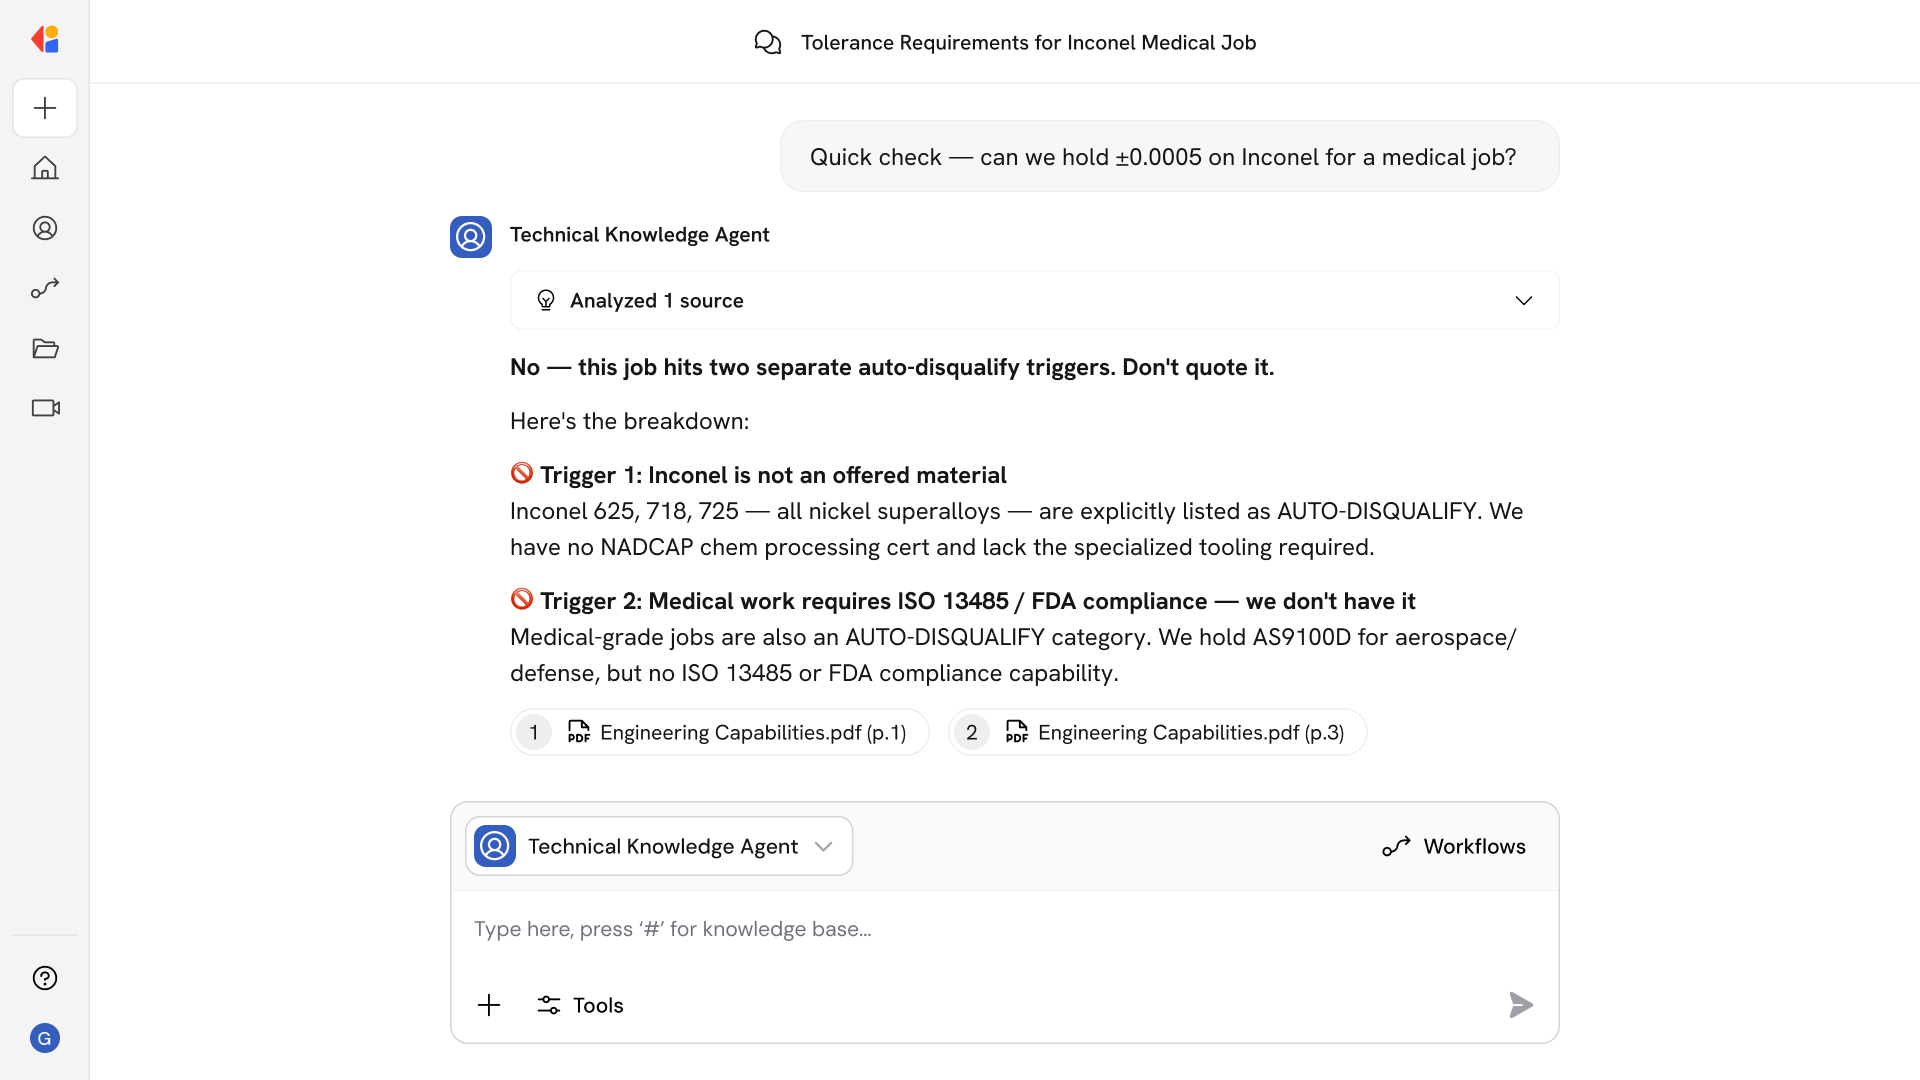
Normalize to a single, consistent schema
Carrier-specific labels, terminology, and codes are mapped to a standardized structure—harmonizing fields like total incurred, paid vs. reserves, cause of loss, and coverage splits across every submission.
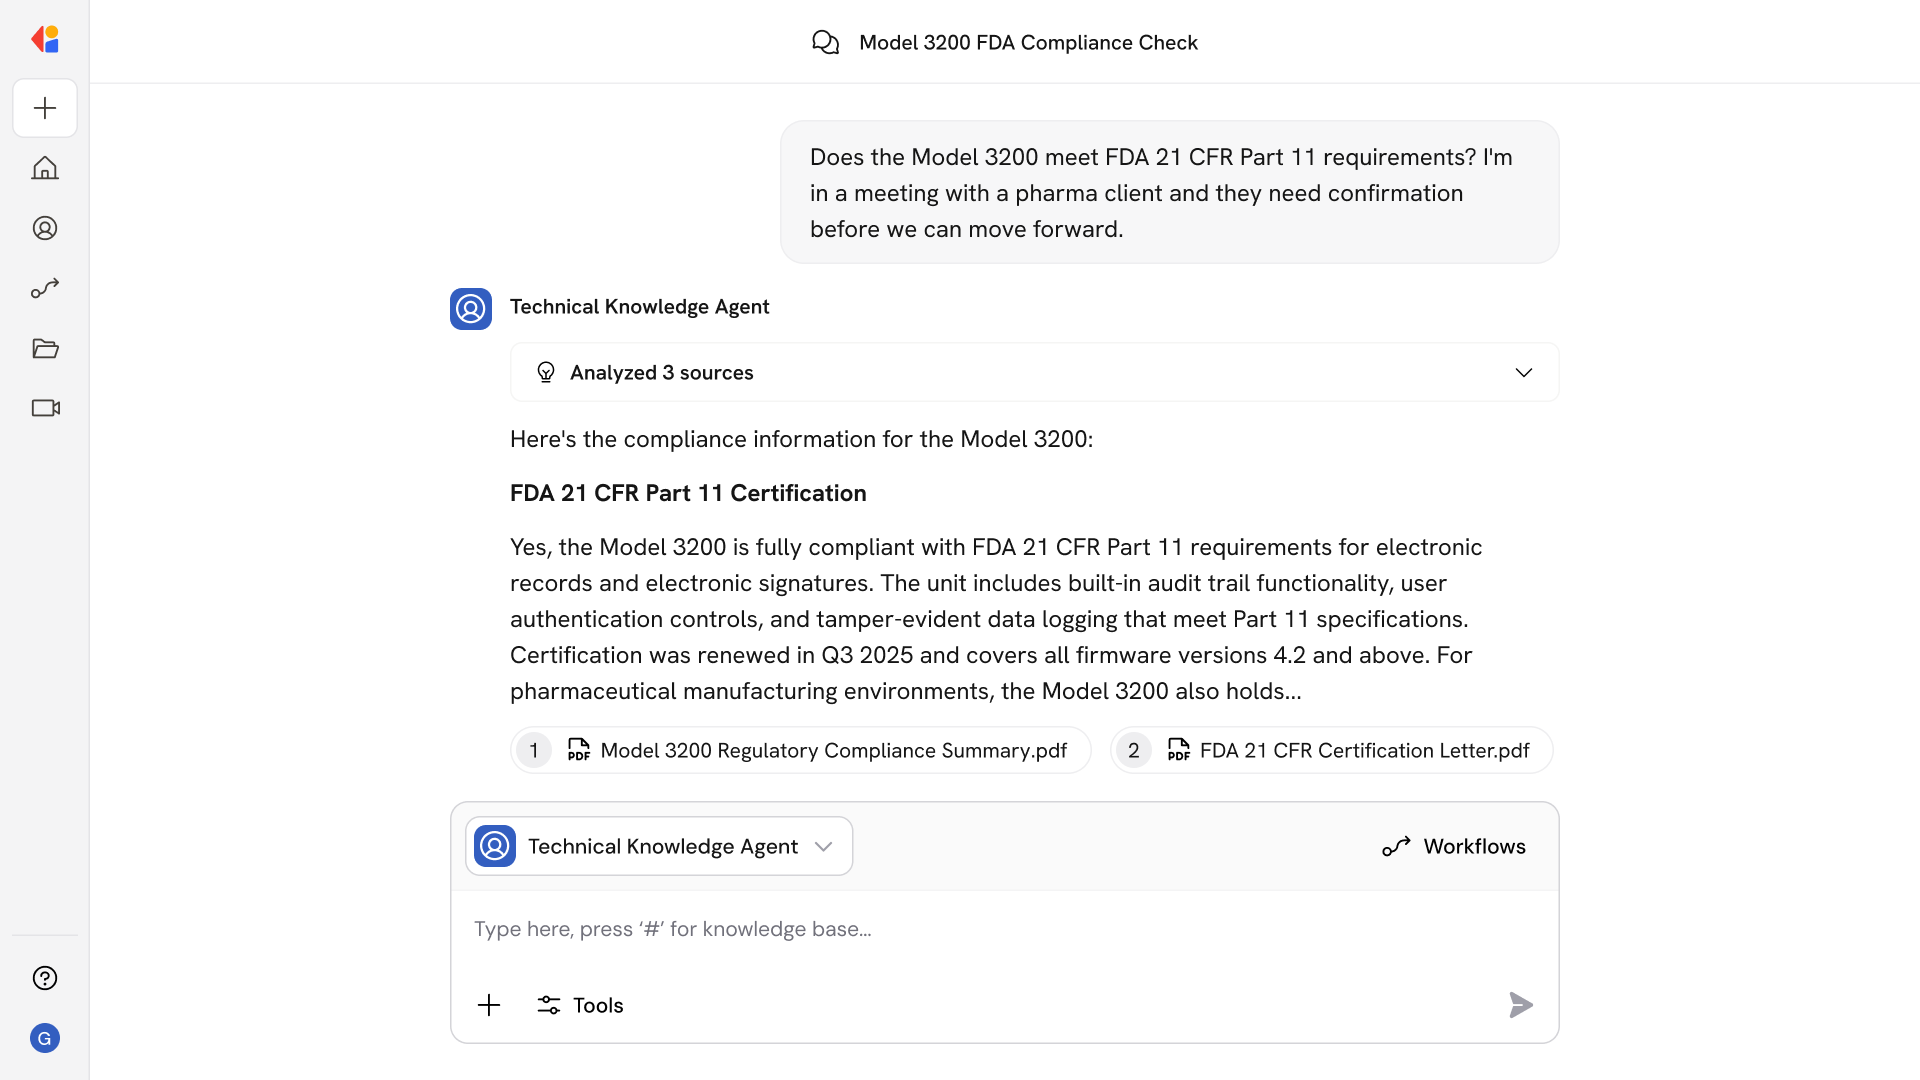
Surface frequency and severity insights instantly
Aggregated analytics by line of business, policy year, cause, and geography reveal trends, large loss concentrations, and outliers—giving underwriters the context they need for confident risk decisions.
How Cassidy automates loss run parsing using AI
Step 1: Trigger on new loss run submission
The Workflow activates when a loss run arrives—whether uploaded by a broker, received via email, or pulled from a carrier portal—and classifies it by account, carrier, and line of business.
Step 2: Extract and structure claim data
Cassidy processes the document using OCR and table detection, capturing claim-level fields including dates, paid amounts, reserves, cause of loss, status, and jurisdiction—even from scanned PDFs with stamps or watermarks.
Step 3: Normalize to your underwriting schema
The Workflow maps carrier-specific terminology to your standard data model, harmonizing labels like “total incurred” vs. “claims paid,” splitting AL/APD and GL sub-coverages, and consolidating multi-line entries per claim.
Step 4: Validate with Human-in-the-Loop review
Confidence scoring flags uncertain fields for underwriter attention. Validation rules catch logical errors—like reserves exceeding incurred—and route exceptions to a review queue with full audit trails.
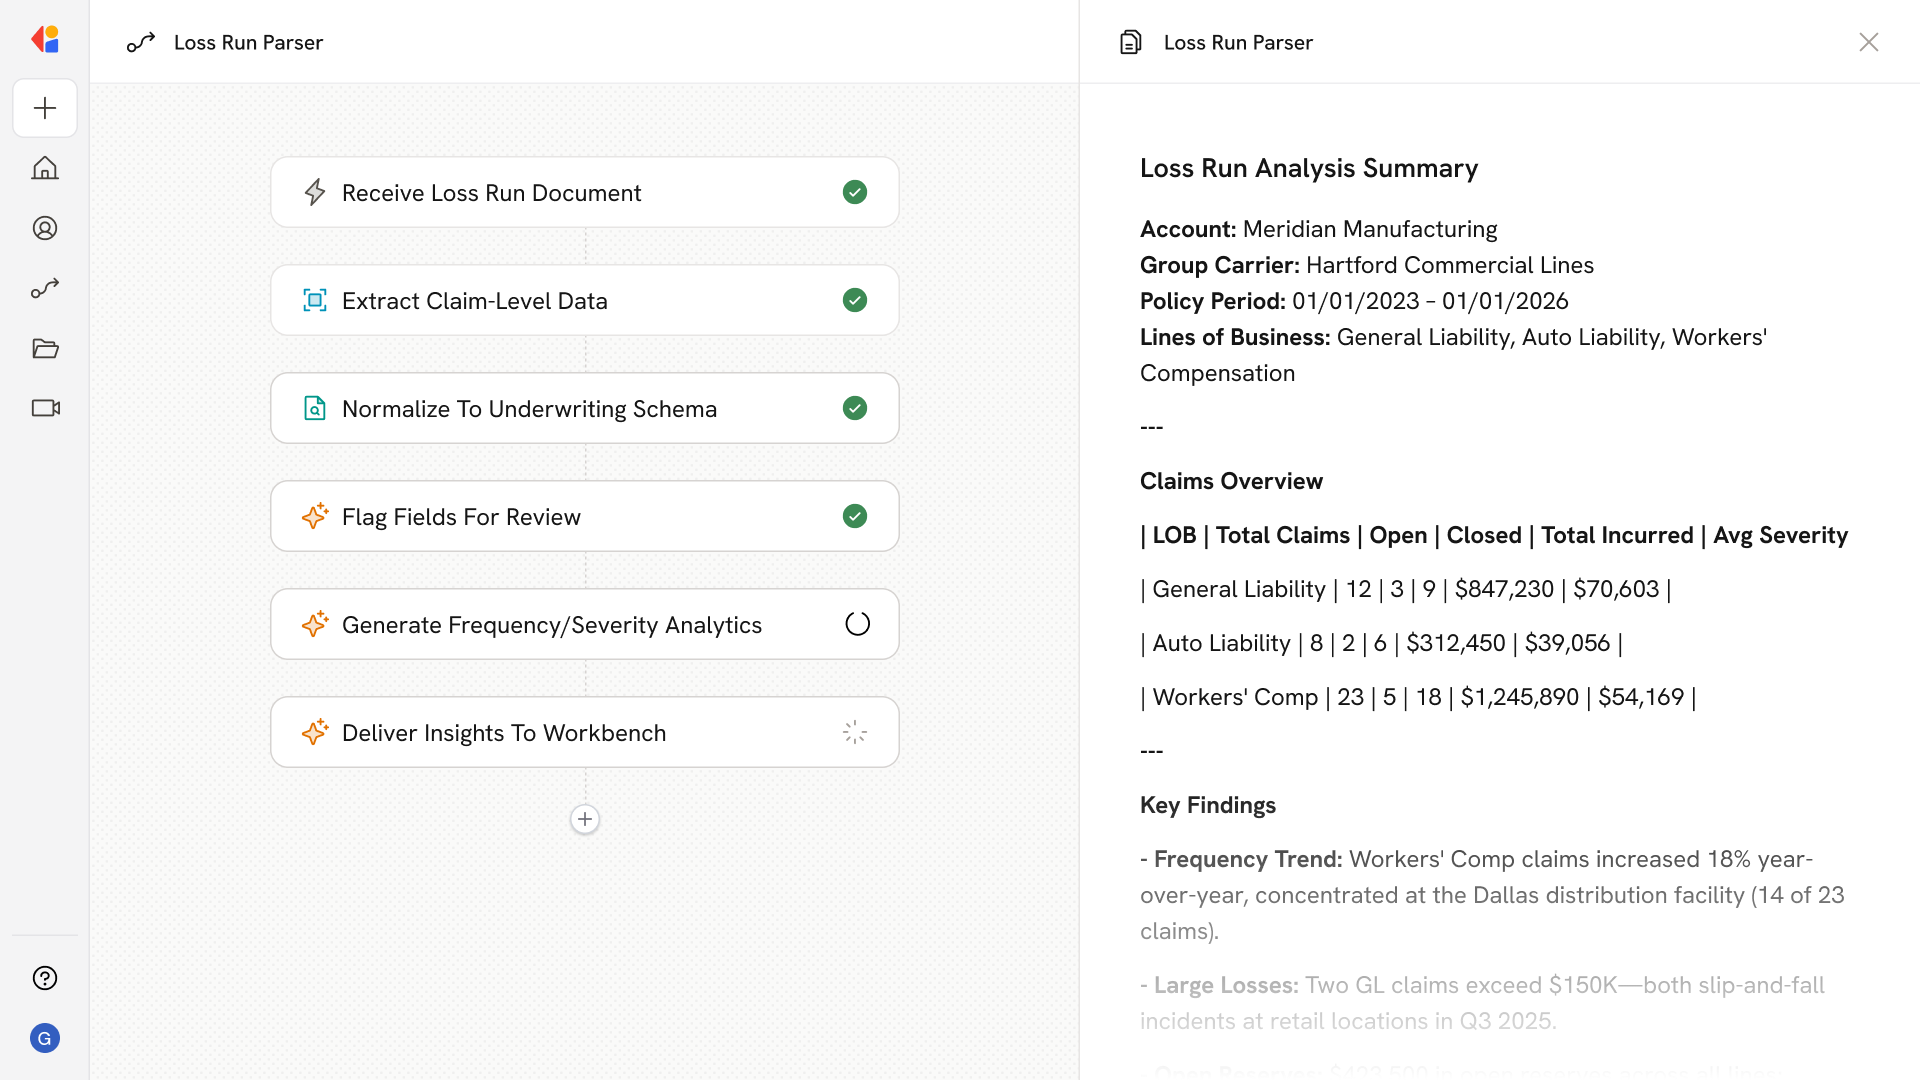
Step 5: Generate frequency/severity analytics
Cassidy aggregates claims by LOB, policy year, cause, and location to surface KPIs: claim frequency, average severity, open reserves, large loss counts, and trend comparisons—delivered as structured data or dashboard-ready outputs.
Step 6: Push insights to your underwriting workbench
Clean datasets feed directly into your rating models and underwriting systems. Narrative summaries highlight trends, hotspots, and recommended risk controls—ready for the underwriter’s decision.
Implement it inside your company
- Hands-on onboarding and support
- Self-paced training for your team
- Dedicated implementation experts
- Ongoing use case discovery
- ROI tracking & analytics dashboards
- Proven playbooks to get started fast