AI Demand Forecast Data Validation Agent
Automating Demand Forecast Data Validation with AI
The agent computes rolling MAPE, WMAPE, and bias metrics across your entire product hierarchy, flagging forecast degradation before it impacts inventory or service levels.
Intelligent drift detection and regime-shift alerts
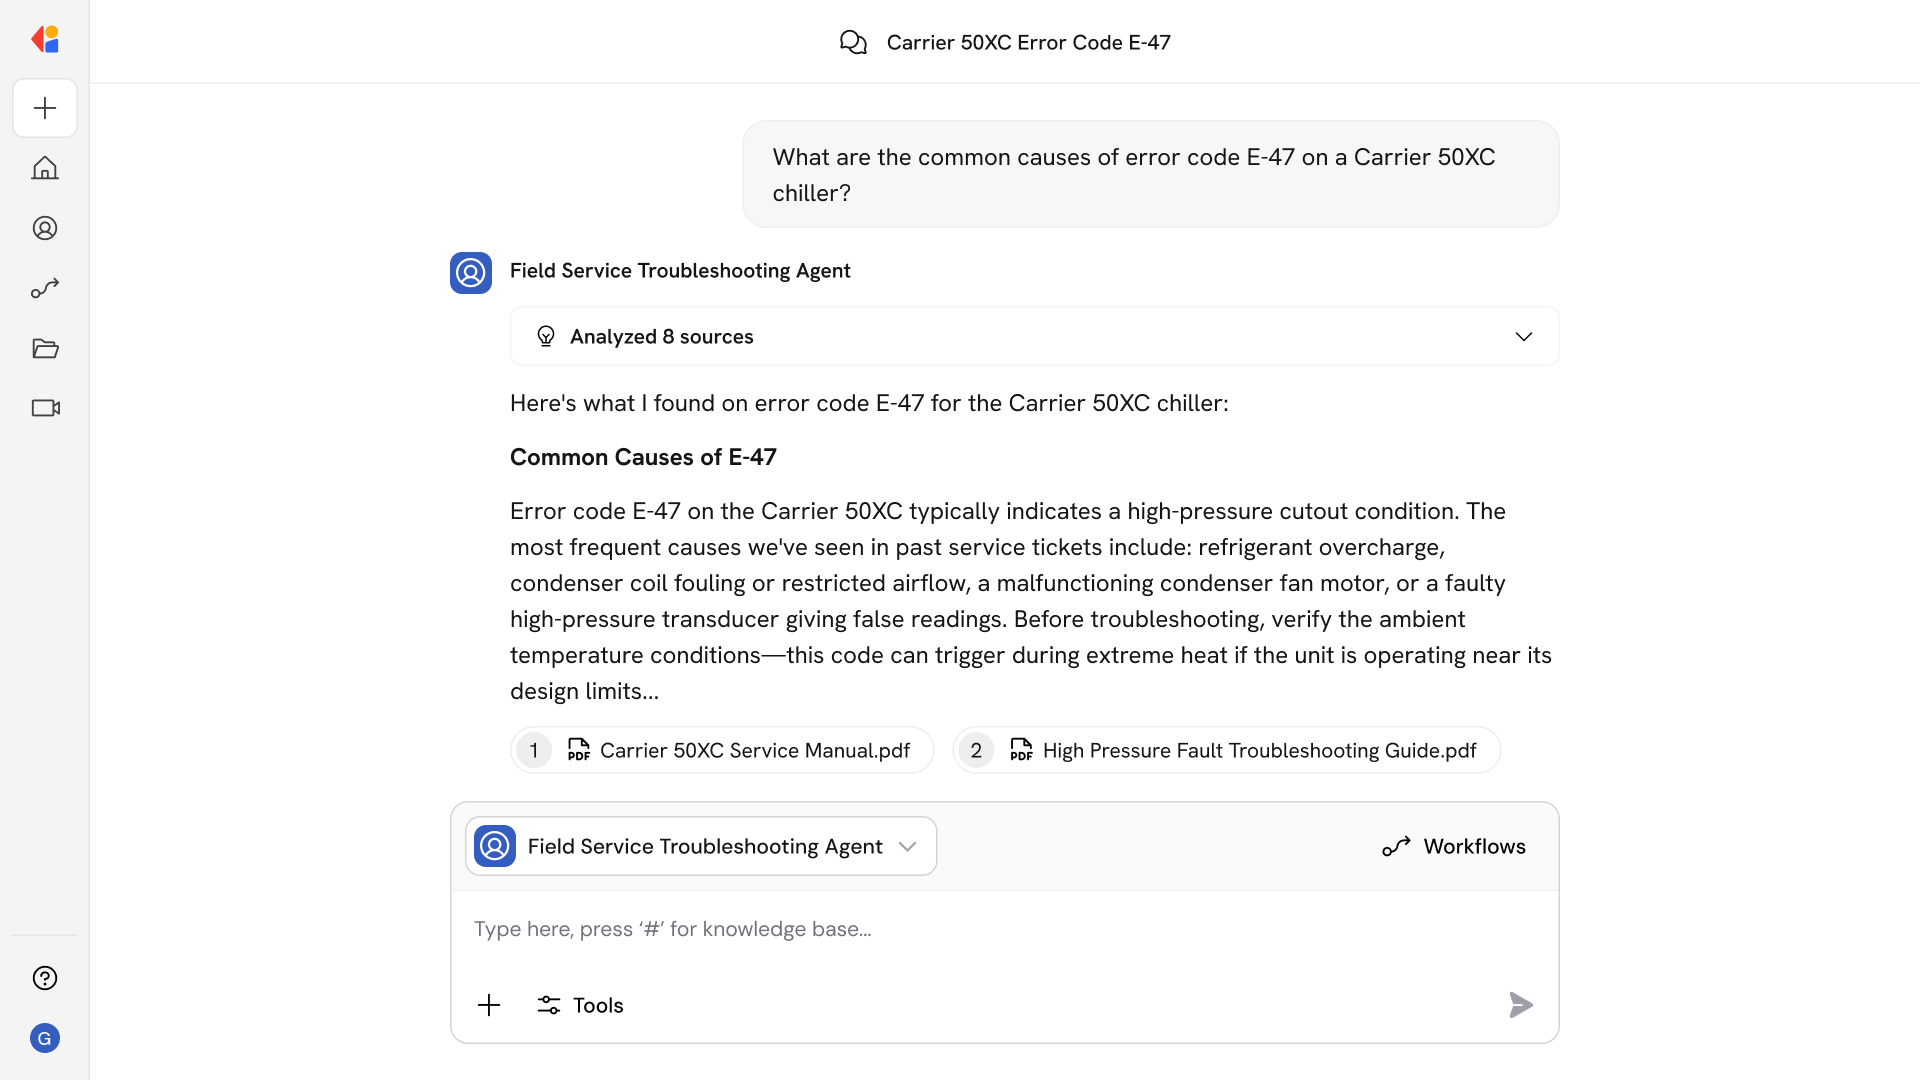
Automated statistical tests (PSI, CUSUM, change-point detection) identify data drift, concept drift, and seasonality shifts—triggering early warnings when historical relationships break down.
Exception prioritization that focuses planner attention
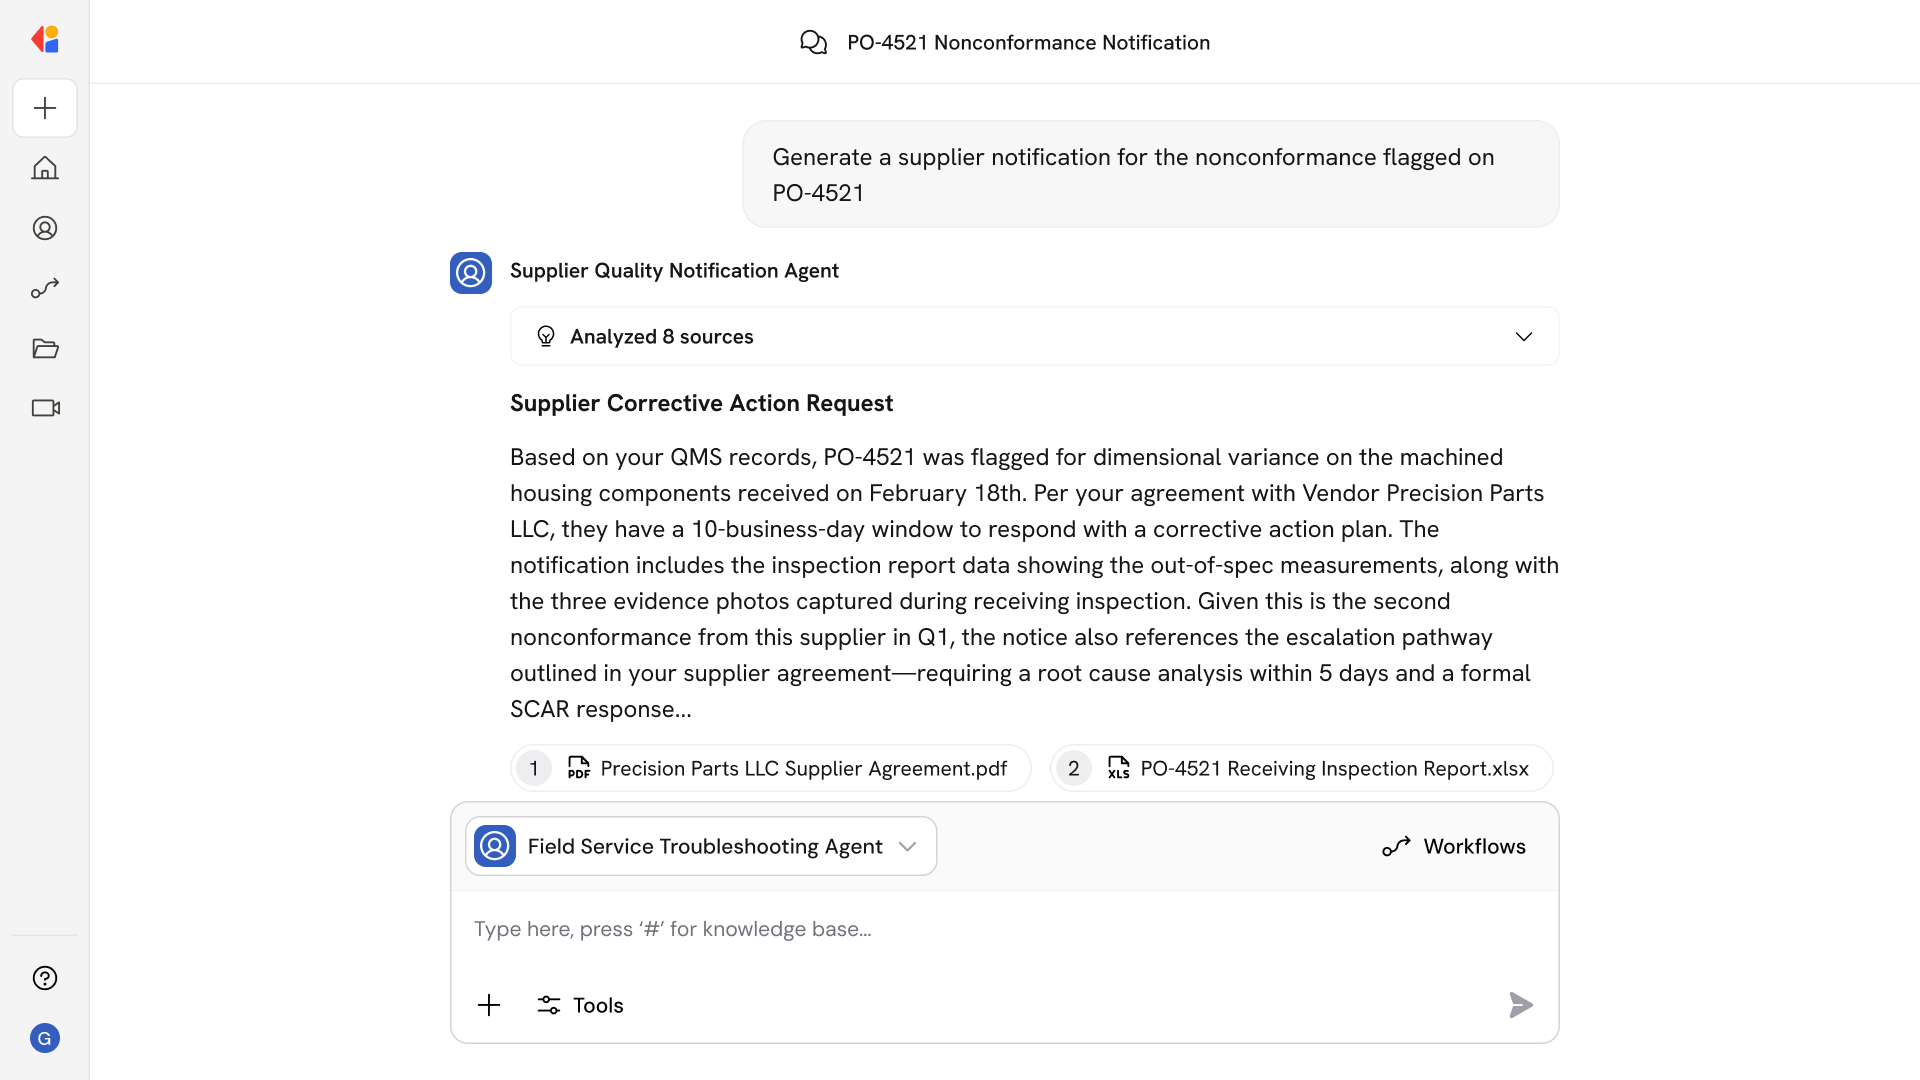
Instead of alert fatigue, the system scores exceptions by revenue impact, lead-time urgency, and signal confidence—routing only high-priority issues to the right owners with actionable playbooks.
How Cassidy automates Forecast Monitoring using AI
Step 1: Ingest and harmonize forecast data
The Workflow triggers on your planning cadence—weekly or monthly—pulling forecasts, actuals, and master data from ERP, APS, and external sources into Cassidy's Knowledge Base. Cassidy normalizes hierarchies, aligns calendars, and resolves unit conversions automatically.
Step 2: Run data quality validation
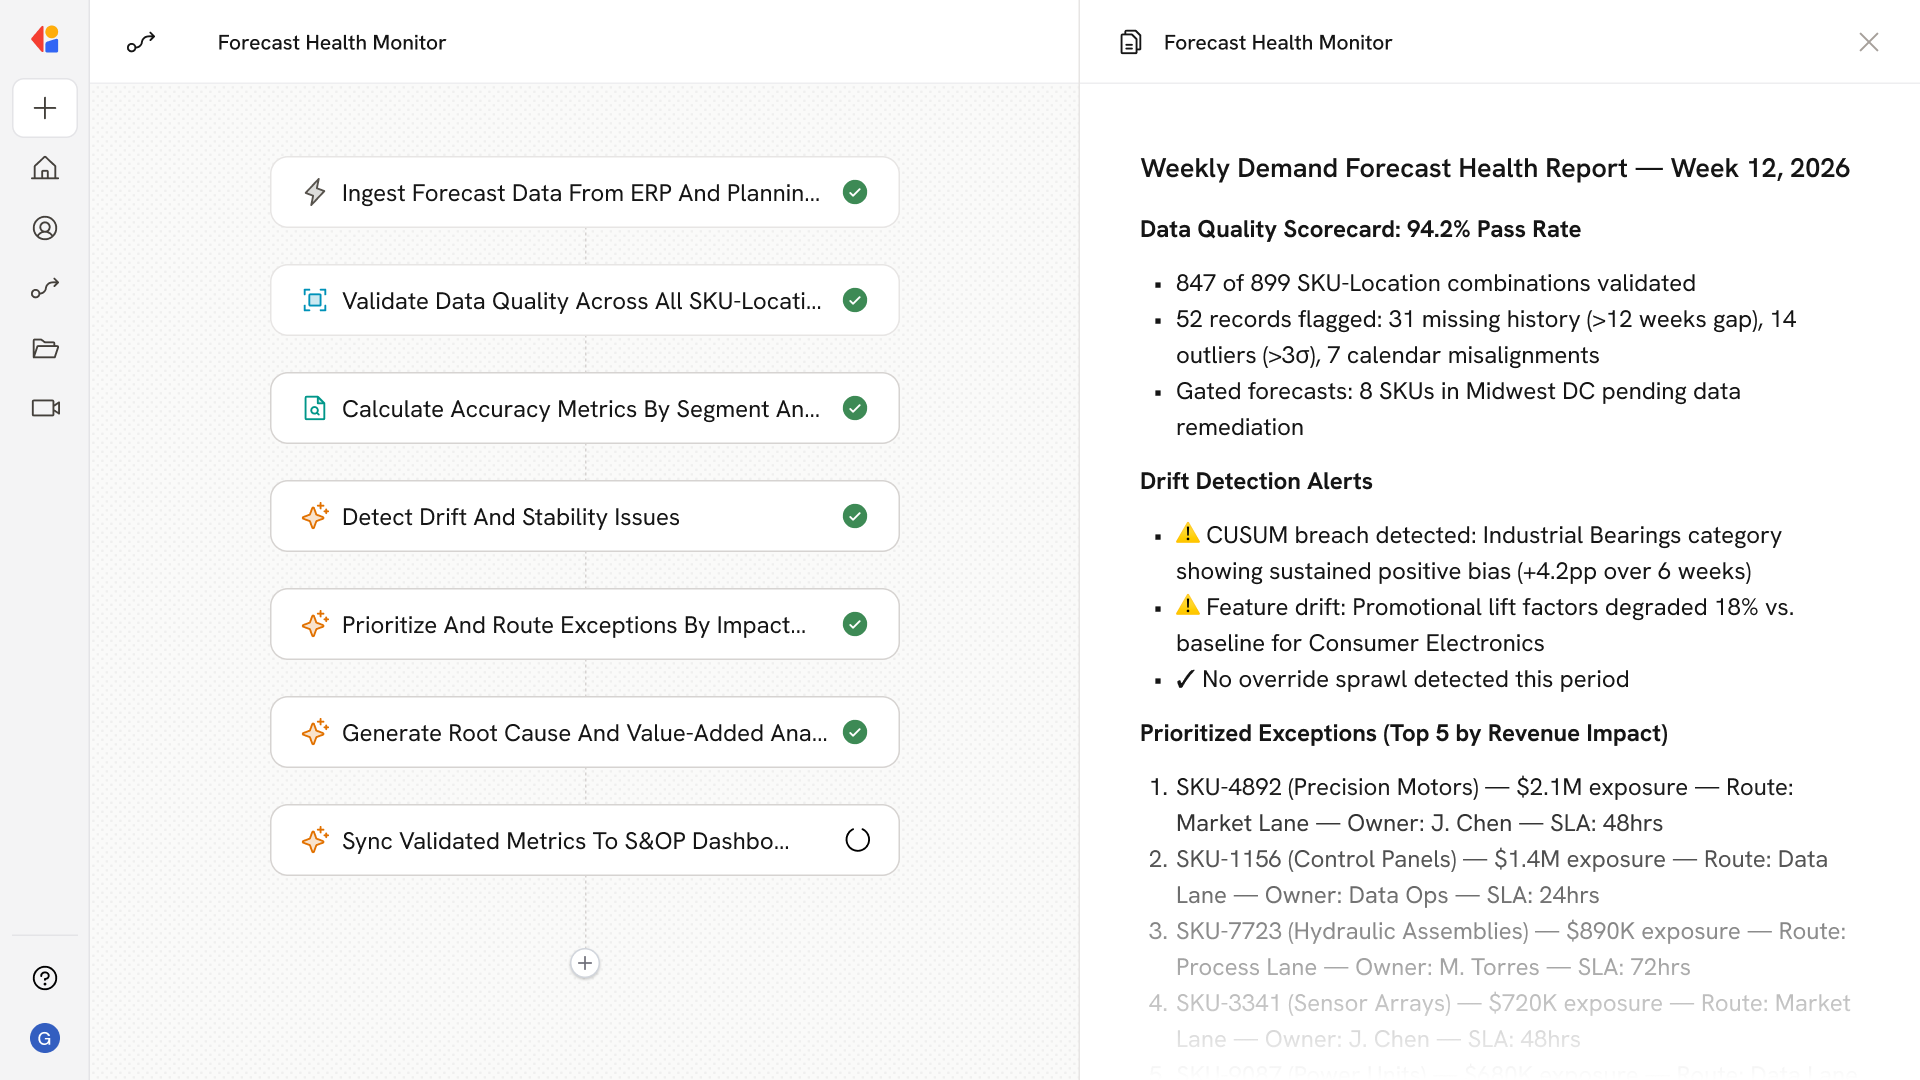
Cassidy executes schema checks, range rules, and missingness analysis across every SKU–Location–Time combination. A Data Quality Scorecard flags incomplete history, outliers, and calendar misalignments—gating forecasts that fall below your defined thresholds.
Step 3: Compute accuracy metrics and bias diagnostics
The Workflow calculates MAPE, WMAPE, MPE, and hit-rate metrics using rolling-origin backtesting matched to your S&OP cycle. Results are stratified by ABC/XYZ class, lifecycle stage, and channel for granular visibility.
Step 4: Detect drift and stability issues
Cassidy monitors feature distributions and residual patterns for signs of data drift or concept drift. Control charts with Shewhart/CUSUM rules surface forecast instability, override sprawl, and reconciliation leakage across hierarchy levels.
Step 5: Prioritize and route exceptions
Exceptions are scored by impact (revenue, service risk) and urgency (lead time, backorders), then routed to designated lanes—Data, Process, or Market—with owner assignments, SLAs, and root-cause playbooks attached.
Step 6: Generate RCA and Forecast Value Added reports
Cassidy produces stairstep FVA analyses showing where value is added or lost (Naïve → Statistical → Planner Adjusted → Consensus), quantifying the contribution of data issues, model gaps, and business drivers to each exception.
Step 7: Integrate with S&OP and trigger corrective actions
Validated metrics and prioritized exceptions feed directly into your Demand Review. Cassidy logs all decisions for audit, schedules retraining when drift thresholds breach, and updates playbooks—keeping planners focused on the highest-impact work.
Implement it inside your company
- Hands-on onboarding and support
- Self-paced training for your team
- Dedicated implementation experts
- Ongoing use case discovery
- ROI tracking & analytics dashboards
- Proven playbooks to get started fast